Trend Lines
With this application, users can create trend lines from vertices and data.
New user? Visit the Getting Started page.
Application
The following sections provide details on the different parameters exposed in the user-interface (trend_lines.ui.json).
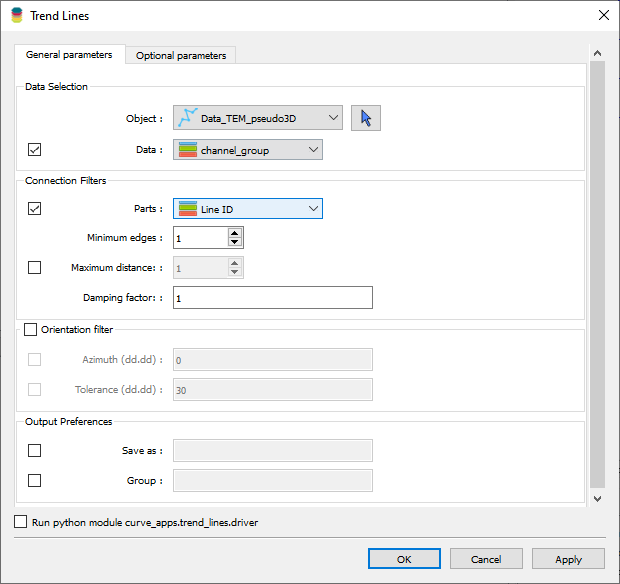
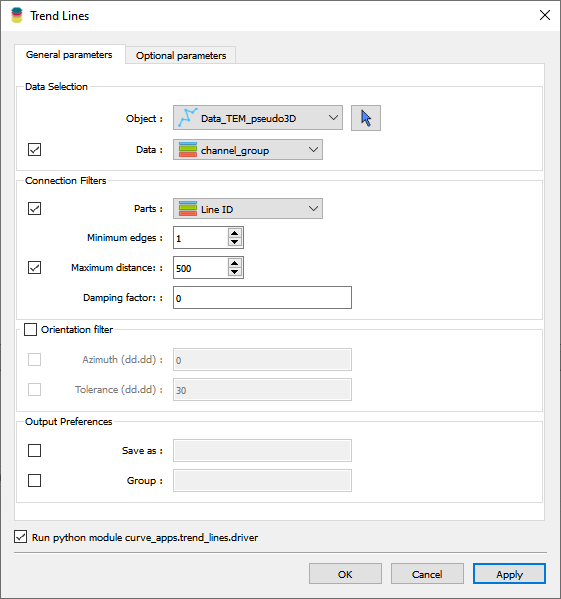
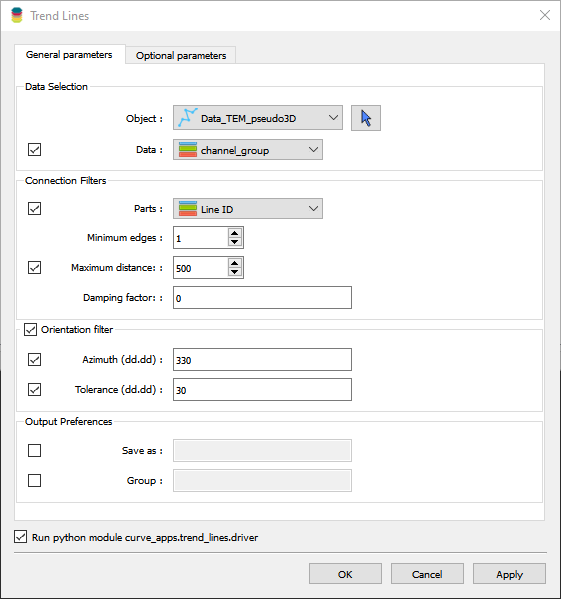
Data Selection
Object: Select the target
PointsorCurveobject from the dropdown list.Data: [Optional] Referenced data defining properties to link with segments. If omitted, the segments will be created from vertices alone.
Connection Filters
Parts: [Optional] Referenced data defining the unique parts of the object. Connections between vertices belonging to the same part are ignored.
Minimum edges: Minimum number of segments for a trend line to be valid.
Maximum distance: Maximum distance between two points to consider for trend line detection.
- Damping factor: Threshold parameter [0, 1] penalizing changes in direction between connected segments.
At 0, the direction change is not penalized, and at 1, the direction change is maximally penalized.
Orientation Filter
Azimuth: Filtering of segments orientation based on the azimuth angle.
Tolerance: Tolerance on deviation of segments orientation from the reference azimuth angle.
Methodology
The conversion from scatter point data to trend lines is achieved by the following steps:
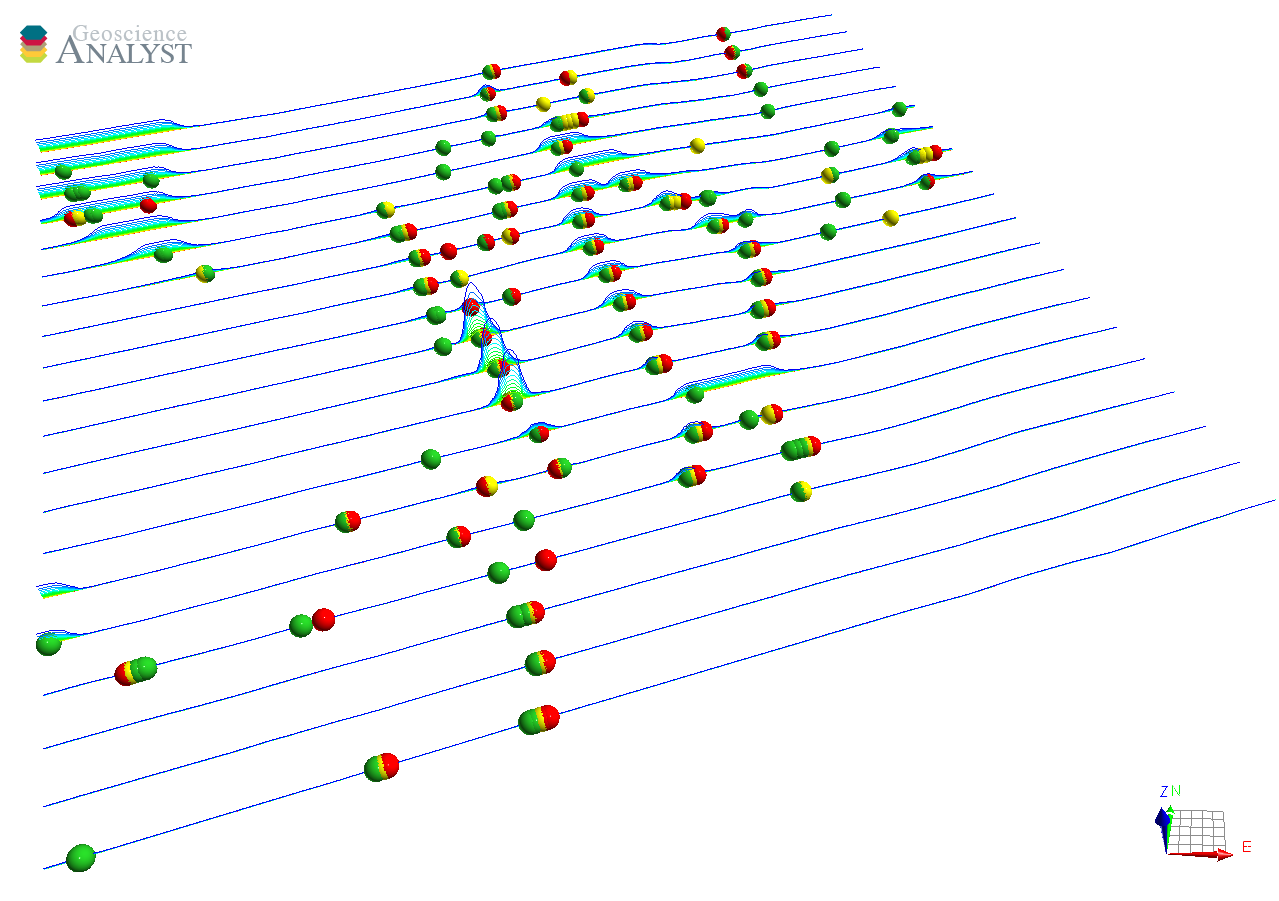
The selected
PointsorCurveobject’s vertices are triangulated to form a Delaunay mesh. The mesh is used to identify the initial edges connecting the vertices.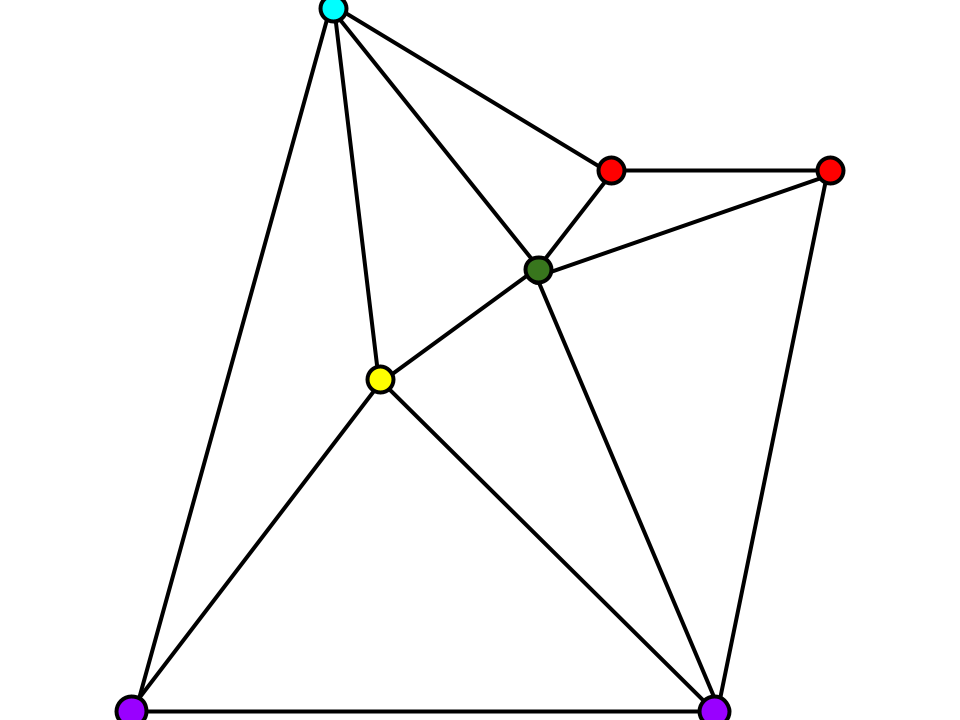
The figure above shows the initial edges connecting the vertices. The color represents the optional
Partsidentifier used for filtering (see Step 2).- Connections get filtered out based on:
Connection too long, defined by the
Maximum distanceparameterSegments connecting vertices on the same part, as defined by the
Partsdata.[Optional] Segments are filtered based on their deviation from a reference
AzimuthandToleranceparameters.
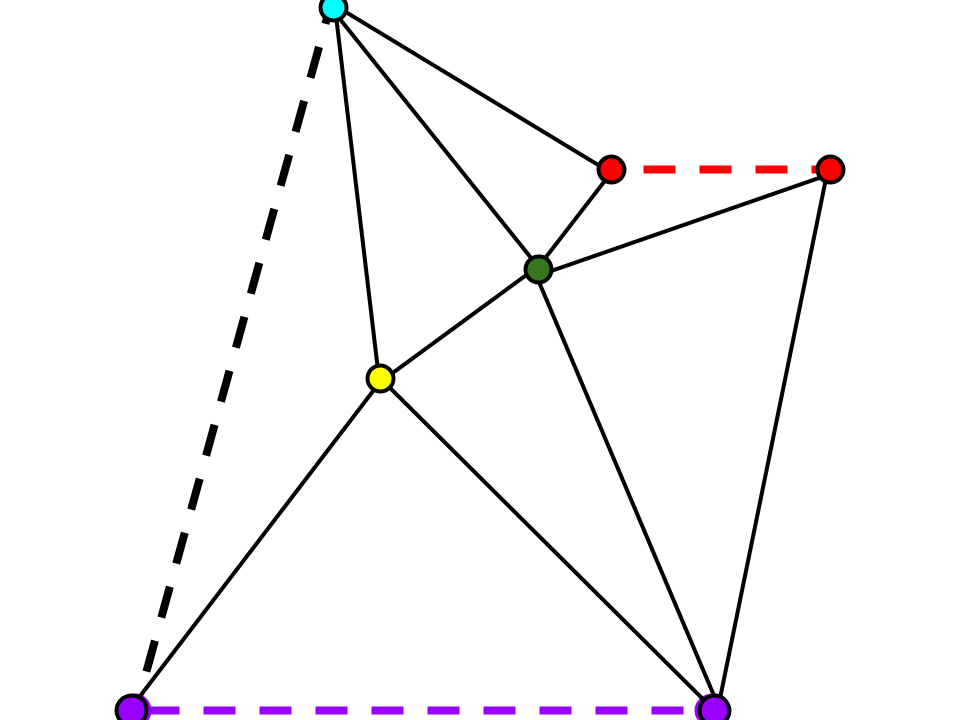
In the example above, the black dash edge is filtered out based on the maximum distance parameter, while the colored dash lines are filtered out based on the parts data. The remaining edges move forward to the detection step.
The remaining edges are visited exhaustively to find the neighbouring connection that minimizes the tortuosity (\(\delta\)) of the path.
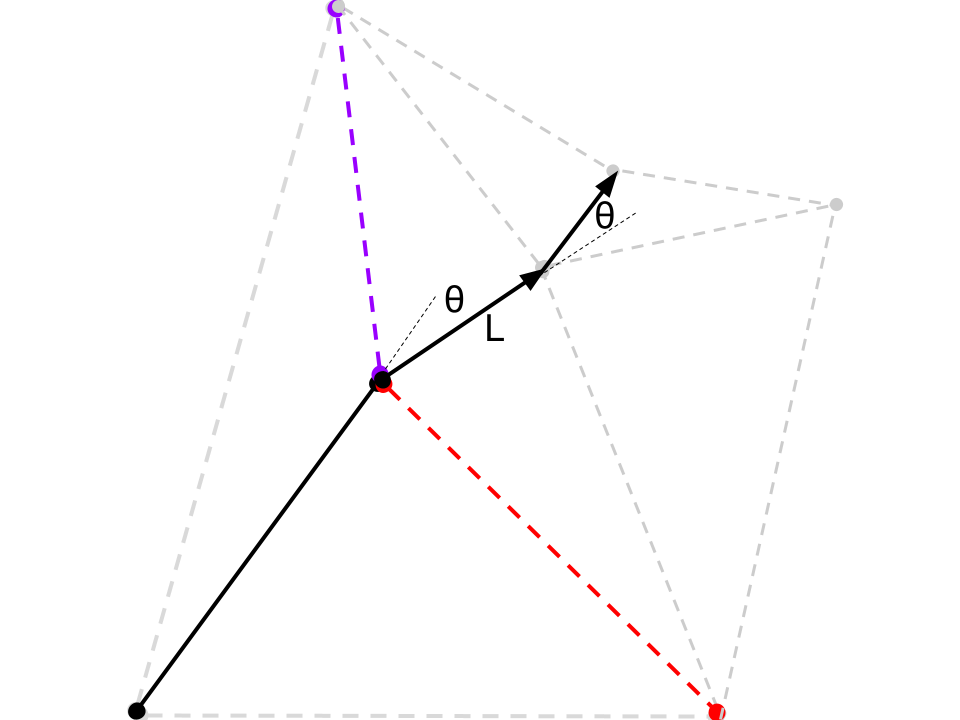
The metric used to evaluate the tortuosity is expressed as follows:
\[\delta = \theta^{(1-\alpha)} * L\]where the angle \(\theta\) is the change in direction between the incoming and outgoing segments, \(L\) is the length of the outgoing segment, and \(\alpha\) is the Damping factor. The path is updated with the connection with the lowest \(\delta\) value. Note that for \(\alpha=1\), only the length of the outgoing segments are considered. This generally increases the number of connections on a trend line, but the path may be more erratic.
This process is repeated recursively until there is no valid neighbouring edge to form a connection with.
Example
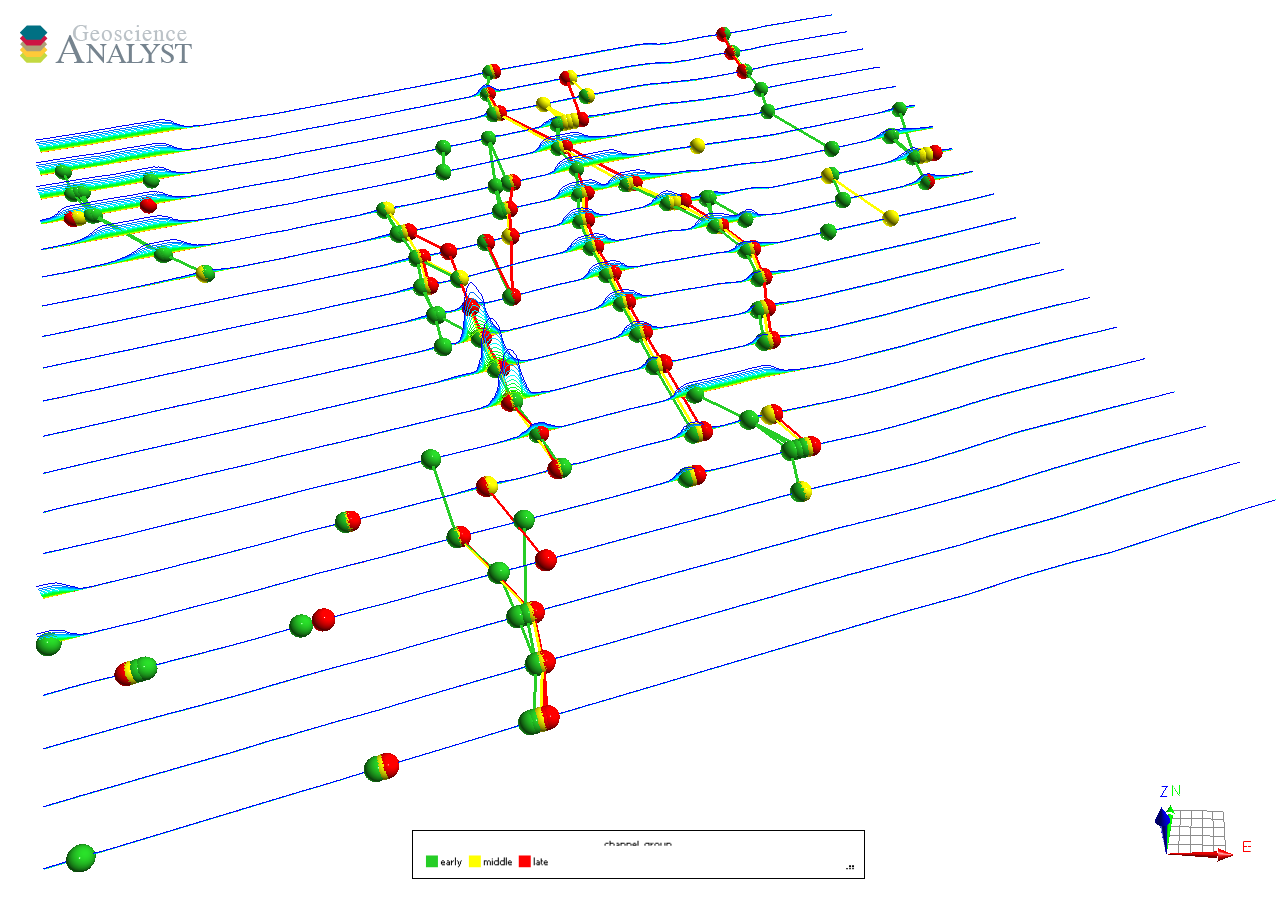
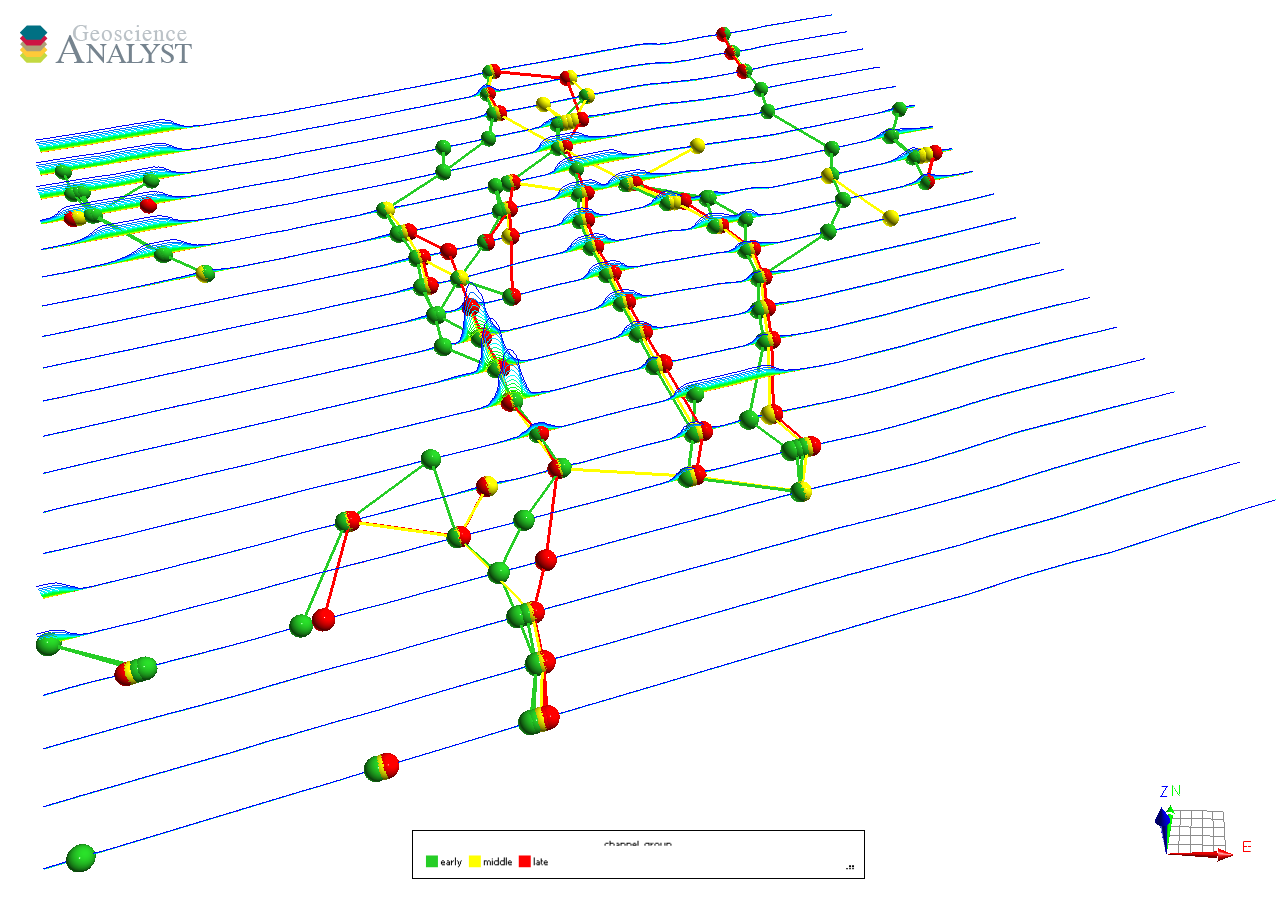
This section demonstrates the effect of various detection parameters on a training dataset provided here.
The goal is to extract trend lines from anomaly picks assigned to a Curve object.
We begin with default parameters and then explore the effect of changing each parameter independently.
We know that the trend lines should connect across the flight lines and not change direction too rapidly.
We can use the Line ID as the Parts data to filter out connections that should not be considered.
Note the we have recovered line paths that connect our input data, but many of those segments are not desirable. They are either connecting points that are too far apart or allowed to change direction rapidly.
We can improve the results by adjusting the Maximum distance and Damping factor parameters.
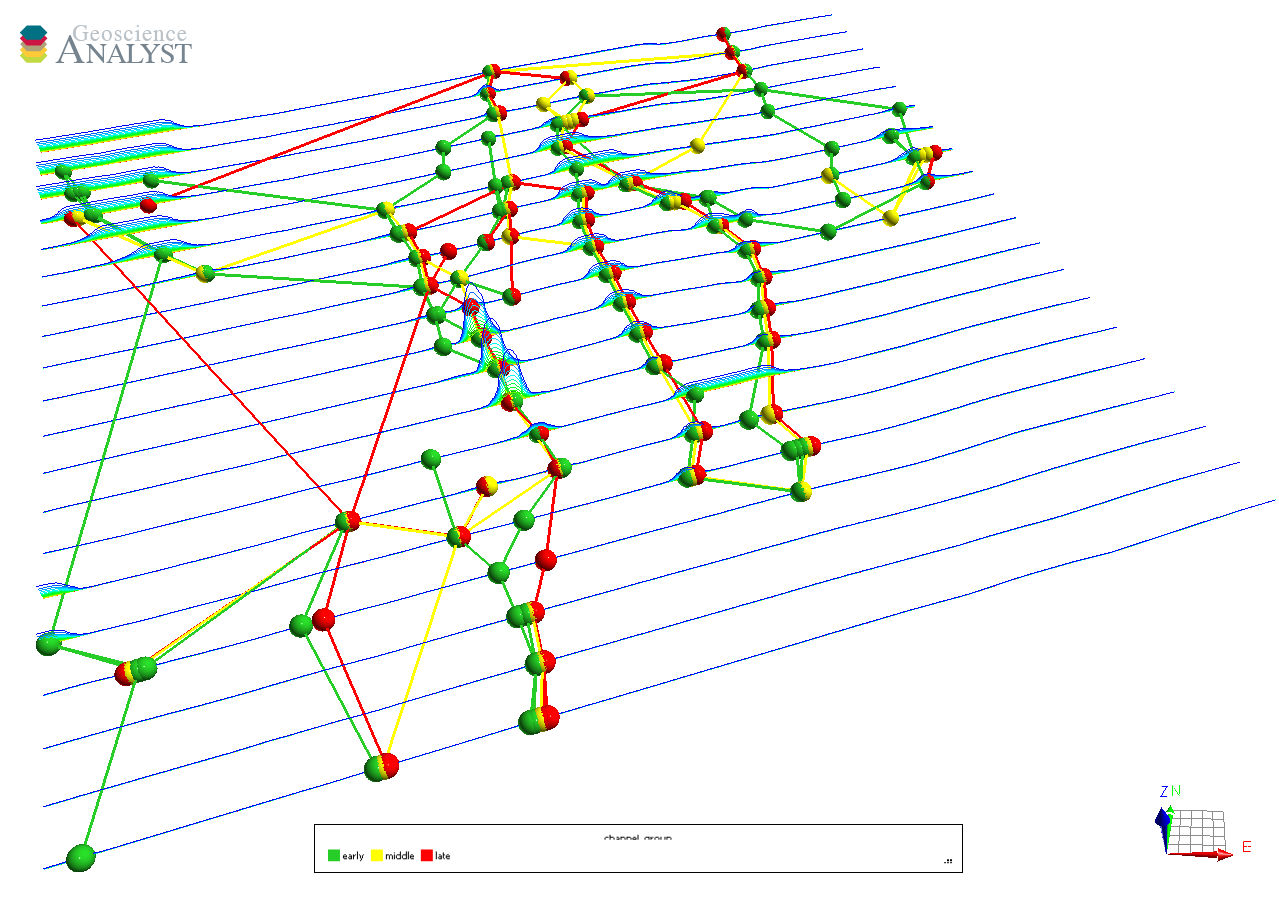
Re-running the application yields the following result:
By filtering out connections based on rapid changes in direction and maximum length, we can obtain trend lines that would better fit a manual picking.
There are still a few segments that are not oriented along the main North-South trend.
We can further filter out these segments by setting Orientation filter with the Azimuth and Tolerance parameters.
Re-running the application yields the following result:
Note that the trend lines now follow the main North-South trend of the data.